Service Design Network
Author - Service Design Network

During the spring of 2019 Dutch newspapers were filled with articles about stress in pharmacies, due to regular medicine switches for patients. These switches are caused by material and medicine shortages, poor deliverability, a change in preferential medicine of various health insurers or pharmacists, or medicine being taken off the market.

Service Design Award 2020/21 Finalist Project

Alleviating stress and frustration during medicine switches - by Koos Service Design

Category: Professional Commercial

Client: BENU (pharmacy chain) and VGZ (health insurance company)

Location: Netherlands

Introduction

The switches stress out everyone involved, from the patients to the specialists and from pharmacists to the general practitioners (GPs). Patients feel frustrated and not in control. Pharmacists and general practitioners feel stressed about the medicine switches, because of the time it takes: pharmacists spend about 1 hour a day explaining to patients what medicine switches entail. GPs spend a similar amount talking to patients that have issues with their new medicine.

A healthcare provider and a pharmacy chain initiated a project to turn this unsustainable situation around. Empathizing with each party has been the key in realizing change. The first result of the project is a toolkit for pharmacists that describes the best way to carry out the conversation at the counter: the first time it becomes clear for a patient that a medicine switch has occurred for him/her. It also includes visual aids for the patient, that help him/her to understand the complex and confusing situation. These results have been launched in October 2020.

Process

When there are multiple stakeholders involved, it is important to show where their experiences meet. To get a full understanding of the issue at hand we interviewed patients (n=12), specialists (n=3), pharmacists (n=5) and general practitioners (n=5). These were explorative interviews that lasted 1 to 1.5 hours. The reason we chose to use this research method was because we wanted to find out whatever needs were present among thesegroups of stakeholders. Before interviewing the stakeholders we made an inside-out customer journey, together with the internal team and with experts on the subject (i.e. pharmacists, GPs and patient council employees). This journey allowed us to be aware of the context at hand and was used as a starting point for the topic lists used to prepare the interviews.

The insights from the interviews were used to create a customer journey. This is a multiple stakeholder customer journey, which allows you to see the connections in the journey among all relevant stakeholders. One interesting take away from the customer journey, is the ‘loop’ that patients tend to find themselves in when looking for answers. They contact various parties (mostly GP, pharmacy and healthcare insurer) but are “sent from pillar to post”. The customer journey can be viewed in full in the attachments, the insights are communicated in Dutch.

The customer journey has been used to find areas of opportunity for improvement. Together with internal stakeholders, the most important areas were selected and thus the scope for ideation was defined. To kickstart ideation, a co-creative session was organised, during which a group of roughly 20 people used several different ideation methods (brainstorming, brainwriting) to come up with an abundance of ideas. The best ideas were selected and elaborated on into concepts. These concepts were further iterated on by ourselves and were the input of a follow-up session.

We considered the ease and level of implementation (system, process, experience) as well as impact of implementation of the selected concepts. Based on these outcomes, several concepts were nominated for further development. To ensure progress we hosted an internal session concerning the realisation of next steps; teams were set up and responsibilities were divided. From the 7 concepts, the healthcare provider selected 4 to carry out first. They are currently running these 4 projects at the same time, the pharmacy chain has co-run one of them. We are glad to have contributed to the latter, by leading the development, prototyping and testing of the toolkit and visual aids mentioned in the introduction.

This process started off with one of the concepts that was chosen to further develop. With our own team, we brainstormed on how to deliver the proposed concept. After several iterations we came to a prototype that we have discussed during two separate focus groups. The participants of these focus groups were mostly pharmacists (n=3) and pharmacy assistants (n=3), the target users of the product. There were also a GP (n=1) and a GP assistant (n=1) present, to give their view on the product. This was done since the final product needs to be accepted by all relevant stakeholders, not just the ones that will be using the product directly (pharmacists and pharmacy assistants).

The focus groups resulted in another round of iterations, after which the final prototype was created to test in one-week pilots in two pharmacies in the Netherlands. Prior to the pilots the pharmacy assistants received training on how to use the product. A week prior to the pilot, a baseline measurement was made on patients’ and pharmacy assistants’ opinion on the current process. This was done using surveys. During the pilot, the same survey was filled out by both target groups. These surveys were then compared to one another to analyse the effectiveness of the product.

During the pilots, it appeared that the product was received with much positive feedback. After some final minor changes to the product and the training of pharmacy assistants, the product is ready for broad implementation. The product is now used in over 400 pharmacies in the Netherlands.

Output

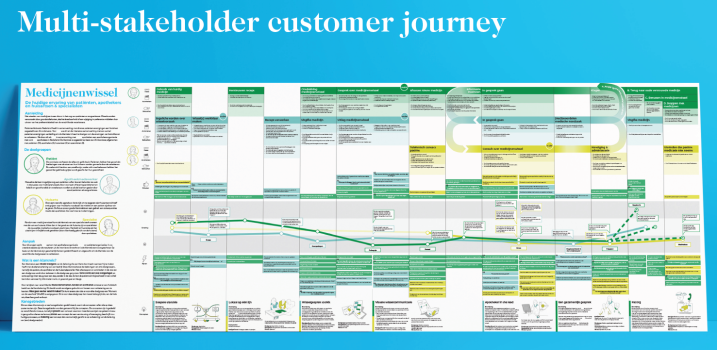
The insights from the explorative interviews were used to create a customer journey.¹ This is a multiple stakeholder customer journey, which allows you to see the connections in the journey among all relevant stakeholders. This customer journey has been used as a tool for innovation, but is also used as a way to convey the problems at hand and to present the seriousness of the matter.

The visualisation is used by team members to look back on when working on the subject, but also to create support in the organisations of all stakeholders. On the left-hand side of the visualisation, you see a short introduction of the subject, followed by the target groups of the project. Then, a short explanation of our approach is given, after which we explain how to interpret a customer journey. Finally, there is a description of several areas of opportunity that we have found in the journey, where we feel it is most important to improve the current situation.

For each target group, we have three ‘swimming lanes’: the name of the phase, the activities that the target user can perform during this phase and the needs that are present in that phase. The next element in the customer journey - which really carries the meaning of the journey and conveys how the target groups feel - is the experience curve. You see that there are 3 lines in the experience curve, one for each target group. Note that the GP and specialist are combined, since their phases in the journey are the same.

The experience curve is enriched with quotes from the interviews, as well as descriptions of the emotions that the target groups are experiencing. Above the experience curve, you can find the gains that are experienced by the target groups, each depicted by their own color. Below the experience curve you can find the pains that they experience. At the bottom of the customer journey, the 7 concepts nominated for further development are visualised with a brief description. These are the concepts that resulted from the co-creative ideation session. One of the most interesting takeaways from the customer journey is the ‘loop’ that patients tend to find themselves in when looking for answers. They contact various parties (mostly GP, pharmacy and healthcare insurer) but are “sent from pillar to post”.

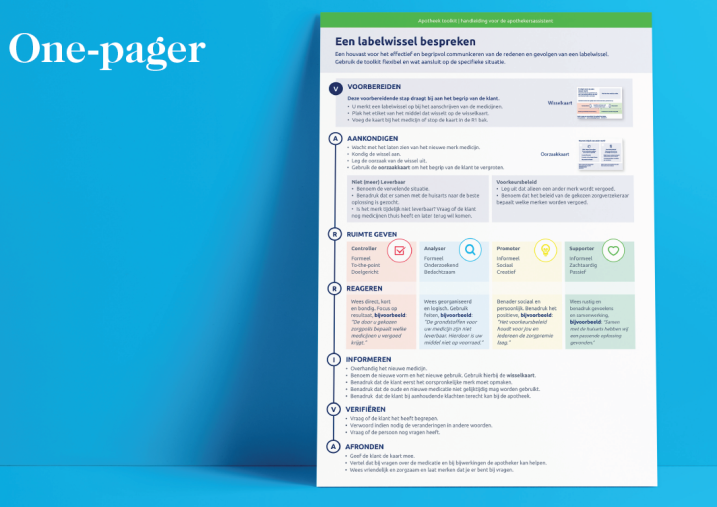
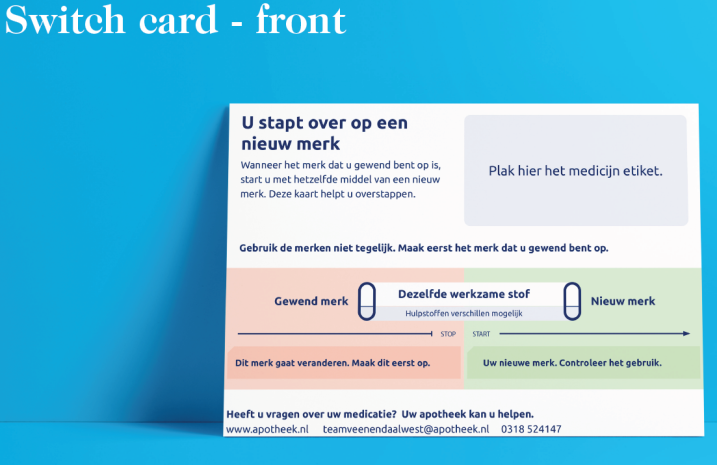
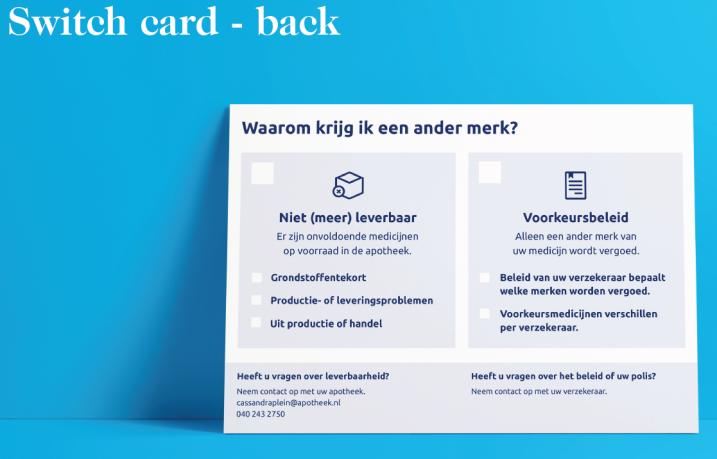
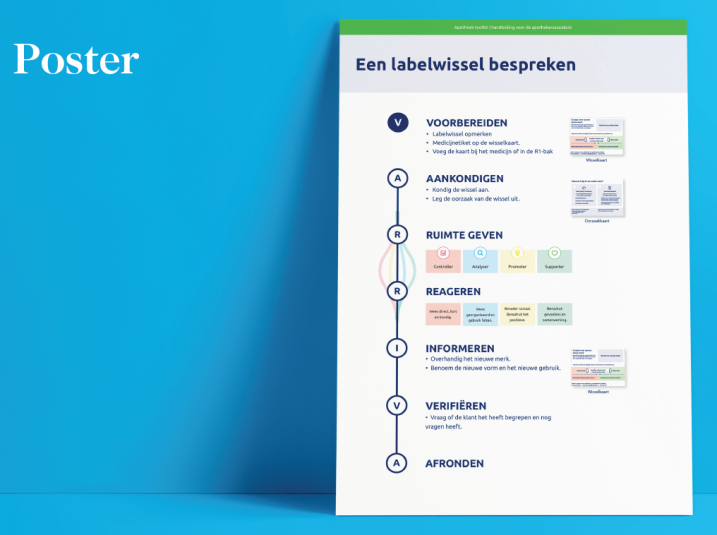
As stated in the introduction, the first result of the project is a toolkit for pharmacists that describes the best way to carry out the conversation at the counter: the first time it becomes clear for a patient that a medicine switch has occurred for him/her. It also includes visual aids for the patient, that help him/her to understand the complex and confusing situation. This result has been created through different rounds of iterations: after internal discussions, two separate focus groups and two separate pilots.

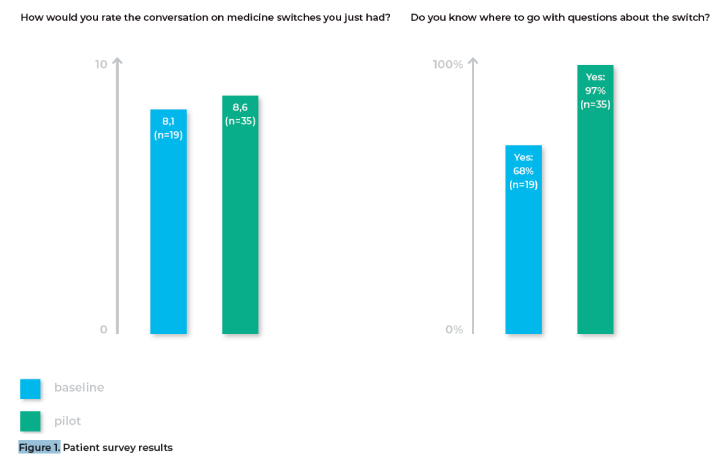
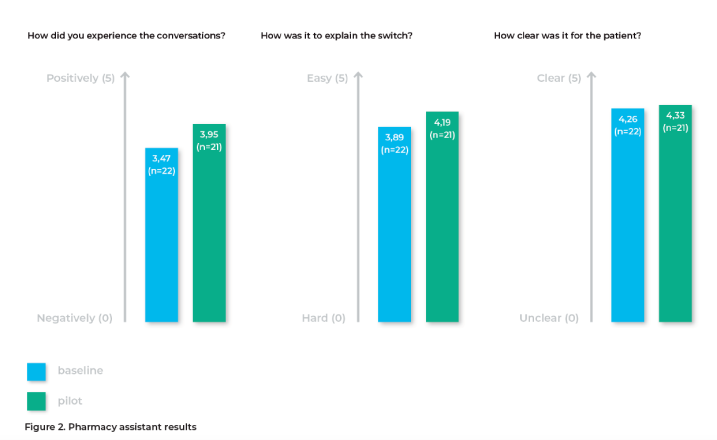
The surveys used during the pilots - for both the pharmacy assistants and the patients - have been added to the visual document. During the pilot, the assistants were instructed on how to use the toolkit and the visual aids. A scenario to help with this instruction is added to the visual document. It is important to note that in every pharmacy the way of working can be slightly different. This required flexibility in how to use the toolkit during the pilot and will require the same flexibility to find a way of working that works for the specific pharmacy it’s launching in.

The main document of the toolkit is the one-pager.⁴ This is an A4 sheet that explains the use of the toolkit concisely. It describes how to prepare and carry out the conversation at the counter. It does so by using an acronym, “ARRIVA”, this acronym is created to help the pharmacy assistant with remembering the steps. The one-pager for instance states that you should wait with presenting the new brand of medicine, since that often elicits a negative response. It also describes how to respond to different kinds of people, expressing different kinds of responses and emotions. It reminds the pharmacy assistant to inform the patient of important pieces of information as well as to verify if the patient understood his/her explanation of the situation.

During the conversation at the counter, it is often difficult for the patient to understand what is going on and what is being explained. This is why we created a double-sided A6-size card. This card is used to explain different elements of the medicine switch. Firstly, it tells the patient which of his pills is the one that changed brand. It also uses visual tools to inform the patient of the fact to not use the old and the new medicine at the same time, or stop in between. This is a problem that often occurs following medicine switches due to the fact that patients don’t understand what has happened.

The ‘backside’ of the card informs the patient of the cause of his/her specific medicine switch. This is something that a lot of patients don’t understand and are really curious about. The visual card is to be used by the pharmacy assistant during the conversation, to help in explaining different elements of the situation. It is furthermore created to let the patient take home, this way he/she can consult the card to understand the situation better.

Finally, the visual document contains a poster. This poster is a summary of the one-pager and is intended to be pasted on the wall in the pharmacy’s lunch room, the door of the bathroom, or a similar place, in order to remind the pharmacy assistants of the best way to carry out the conversation with the patient.

“The largest pharmacy chain in the Netherlands has launched the toolkit including the visual aids in their pharmacies.”

Impact

The impact of this project is high. One million Dutch patients each year are affected by medicine switches. 78% of these patients indicate that they have issues with the switches. These patients’ experiences are now improved with the implementation of the toolkit. Furthermore, it has become clear from our interviews that also (assistants of) GPs and (assistants of) pharmacists find the switches annoying, stressful and time consuming. With this project we have aimed to minimize the issues that all target groups have with medicine switches.

The toolkit for pharmacy assistants and visual aids for the patient have a certain impact on the aforementioned issues. To analyse the effectiveness, surveys were used prior to and during the pilots. The results of these surveys are shown below. As can be seen, the toolkit and visual aids used during the pilot, improved the experiences of both the patients and the pharmacy assistants. Qualitative results from the survey were used to make iterations on the toolkit and visual aids.

The scale of the impact is firstly nationally: the largest pharmacy chain in the Netherlands has launched the toolkit including the visual aids in their pharmacies. The toolkit can be used in other countries, if the same problem exists in that area. Another way that impact was created with this project, is by introducing several people with our way of working. A lot of employees of the clients that initiated this project have come to appreciate the customer-centric approach that we take. This will cause more focus on customer needs within the organizations. As discussed, other kinds of stakeholders also contributed to the project.

They also appreciated our way of switchesworking, though these stakeholders often already worked in a customer-centric way. A lot of potential impact is still to be made. As stated before, the toolkit that we created was just one of four projects that started. These other projects are still running, and have been initiated thanks to our research. The possible impact that these projects will have on the target groups is significant. The impact made with this project matched the initial objective, being to make the situation around medicine switches less stressful for all target groups. For patients and pharmacy assistants this has now been achieved, for the other target groups this impact is currently theoretical.


Conclusion

What makes this project special for me, personally, is the societal impact that it has and will have. Patients feel frustrated and not in control. Pharmacists and general practitioners feel stressed about the medicine switches, because of the time it takes: pharmacists spend about 1 hour a day explaining to patients what medicine switches entail. GPs spend a similar amount talking to patients that have issues with their new medicine. I’m really glad that we are going to make a change for them. So I am proud of the role we play in improving the experience for all parties involved.

Project Team:

BENU: Claudia Berrevoets-Keizer

VGZ: Elvira Arts

Koos Service Design: Michaël Vijfvinkel, Joost van Leeuwen, Saskia Mosterman

Related Community Knowledge

Service Design Award Transforming the US Health System: A toolkit for designing a new era of Alzheimer’s care

Transforming the US Health System: A toolkit for designing a new era of Alzheimer’s care

Service Design Award 2023 - Professional Commercial Finalist

Continue reading
Service Design Award Nemo: The Finnish Maritime Single Window

Nemo: The Finnish Maritime Single Window

Service Design Award 2023 - Winner, Best Commercial Project

Continue reading
Service Design Award Inspiring Action for Teacher Retention from the Inside Out

Inspiring Action for Teacher Retention from the Inside Out

Service Design Award 2023 - Professional Commercial Finalist

Continue reading
Service Design Award Fast Stream: A new post-pandemic digital service

Fast Stream: A new post-pandemic digital service

Service Design Award 2023 - Professional Commercial Finalist

Continue reading